Exponential Moving Average vs Simple Moving Average

Exponential Moving Average vs Simple Moving Average

If you are just getting into the world of trading, then one of the most important things that you need to know about our moving averages. If you don’t know what a moving average is in comparison to stock market and Forex trading, then you are going to have a big problem making money. When it comes to technical analysis, moving averages are some of the most important things that you need to know about.

With that being said, there are two different types, and these include the simple moving average and the exponential moving average. Both provide you with the same type of information, but they are quite different and quite honestly one is better than the other. Today we are here to compare the exponential moving average to the simple moving average to see exactly what they are and what the differences between them are.

Moving Average

What is a Moving Average?

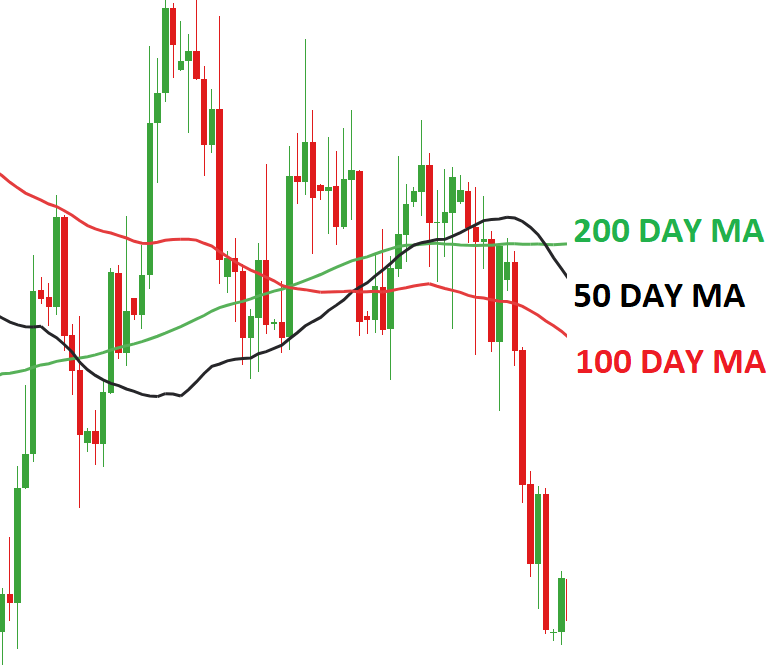
OK, so a moving average is a specific type of technical analysis indicator that is commonly used in a variety of trading markets, including the stock market, Forex, cryptocurrencies and more. Now, in terms of the four different types of indicators out there which include volume, trend, volatility and momentum indicators, this is actually a type of trend indicator.

 In other words, a moving average can help you as a trader keep track of price trends for specific securities or assets.

If there is an upward trend in a moving average, it could signify an increase in the price or the momentum of a specific security and vice versa. To put it in simplest terms, a moving average will inform you of the trend of a specific security, or in other words, in which direction the price is moving, and it will also inform you of the momentum, to a certain degree.
Moving Average (MA) Explained for Traders


Simple Moving Average: The Basics

The first type of MA that we want to look at is the simple moving average, which as you might be able to guess by the name of it, is the simpler of the two types of moving averages. To provide you with a basic definition, the SMA calculates the average of the price within a selected range.

In other words, it takes a specific amount of closing prices of a security or asset and then divides it by the number of periods in that range. The simple moving average to put it in simplest terms, is a technical indicator that can help determine if the price of an asset will continue to rise or if it will reverse.

In other words, they can tell you if there is a bull or bear trend on the horizon. This is a very simple yet effective trend indicator that Forex traders stock market traders and cryptocurrency trader used to determine when and where to place trades.

Moving Average

How to Calculate SMA

In case you are wondering how to calculate the SMAD, this is actually done quite easily. For instance, if you are calculating the SMA of a five day. Then you would take the closing prices of all five days an add them together and then divide them by five for those five days. Take a look at the extremely simple example below for a good idea of what the SMA calculation is all about.

$8+$9+10+11+12 = $50

$50/5 = 10

Pros & Cons

Just as with any technical analysis indicator out there, that simple moving average does have a variety of benefits as well as some drawbacks too.

Pros
  • The SMA offers a very smooth line that is not prone to website up and down in response to very slight and temporary price swings.
  • The SMA is best used for longer periods of time.
Cons
  • The primary drawback of the SMA is that it is very slow to respond to rapid price changes that occur at market reversal points.
  • Because the SMA is quite slow to respond, it does not work well for short time frames.

Exponential Moving Average

The next type of MA that we want to look at is the EMA, which as you can probably tell, is the more complicated type of moving average. The EMA or exponential moving average is another type of technical chart indicator that tracks the price of an investment such as a stock, commodity or even a currency pair over a specific period of time.

Just like the SMA, the EMA is also a trend indicator that can signify in which direction or what the trend of the prices, and to a certain degree it can also indicate the momentum of a security or asset’s price.

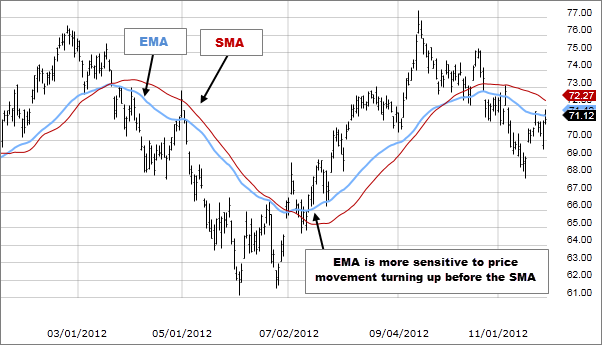
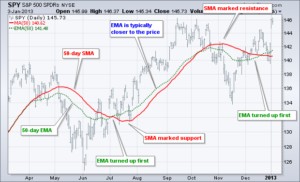
However, the big difference here is that the EMA is a type of weighted moving average or WMA, or in other words it gives more weight or importance to the most recent prices. Due to the fact that the exponential moving average puts the most weight or importance on the most recent prices, it is therefore ideal to use for short time frames.

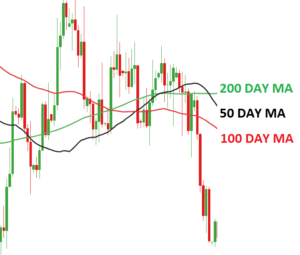
With that being said, the exponential moving average is a bit more accurate and useful than the simple moving average. In terms of longer timeframes, the TMA can be used for 50 day, 100 day and 200 day periods. The typical time periods used for short term trading include the 12 day and 26 day EMAs.

Moving Average

How to Calculate EMA

Now, calculating the EMA is a bit difficult, so bare with us, as we will do our best to explain this to you in the simplest possible way. Yes, this is where things can get really confusing, but with a bit of practice, you should be able to master calculating an exponential moving average.

So, to calculate the EMA, you first need to obtain the SMA for a specific period of time. For instance, if you have a 20 day time period, you need to calculate the SMA for that period, and then, on the 21st day, you can use the SMA of the previous 20 days as the first EMA for yesterday.

You must then also calculate the weighting or the smoothing factor for the EMA, which is [2 / (number of observations) +1], which in this case would be [2/(20+1)] = 0.0952.

The final step of the calculation of the EMA is EMA = closing price x multiplier + EMA of previous day x (1 – multiplier). Yes, this is of course a bit complicated, but with just a little bit of practice, you should be able to master this calculation with relative ease. Just go to some price charts and give it a shot.

Pros & Cons

Just like the simple moving average has benefits and drawbacks, so does the exponential moving average.

Pros
  • Due to the fact that the most importance is given to the most recent prices, the exponential moving average responds very quickly to recent price changes. This can be very useful to intraday traders who are trading on very short time periods.
  • The EMA is much better at calculating short term trend reversals and changes than the SMA.
Cons
  • The disadvantage of the exponential moving average is that it’s fairly vulnerable to false signals and can be whipsawed back and forth.
  • The exponential moving average is definitely not the best choice to go with for long term trading.

FAQ

  1. What is the 20 EMA?

The 20 EMA is considered to be the best moving average to use for daily charts because the price follows it very accurately during a trend. If a price is above the 20 line, it can be considered a bullish trend, and if the price is below the 20 line, it can be considered a bearish trend.

  1. Why is 200 EMA Important?

The 200 EMA is considered to be very important for the identification of long term trend and can be easily applied to any security. It’s a great indicator to use to identify reversals.

  1. What is the 21 Day Exponential Moving Average?

The 21 day EMA places a whole 9.% of importance on the most recent price, whereas by comparison, the 100 day EMA places only 1.9% weight on the most recent price. Therefore, the 21 day EMA is excellent for identifying short term trends.

  1. What is the best EMA for Day Trading?

If you are engaging in short term trading, the best EMAs to use are the 8 day and 20 day EMAs, and for long term investors, the 50 day and 200 day EMAs work really well.

  1. Which EMA is Best for Forex?

Depending on what your needs are, the most commonly used EMAs in Forex include 5, 10, 12, 20, 26, 50, 100, and 200 day time frames.  

  1. Which EMA is best for Intraday?

If you are intraday trading, then the 8 day and 20 day EMAs are usually best.

Moving Averages – Final Thoughts

You should now know everything that there is to know about both the simple moving average and the exponential moving average. Now that you know the basics about them both, as well as what they are both ideal for, you can make an informed decision as to which one to use for your next trading adventure.


Remember folks, if you need help day trading, and what you need is a comprehensive education, particularly on Forex trading, then the best place to be is the Income Mentor Box Day Trading Academy. At this time, the IMB Academy is the most comprehensive, user friendly, effective, and affordable Forex trading school out there.  
CLICK BELOW TO JOIN INCOME MENTOR BOX AND START MAKING REAL PROFITS! 

Forex Exponential Moving Average Scalping

Forex Exponential Moving Average Scalping

OFFICIAL SITE: INCOMEMENTORBOX.COM

In Forex trading, scalping is a popular method, one which provides lots of small profits, and the best way to go about this is by using exponential moving averages. No, it’s not the only way to scalp trade in Forex, but using EMA as your top technical analysis tool definitely works quite well.

Today, we are here to discuss moving averages, specifically exponential moving averages, what they are, and how to calculate them too. As you will then find out, our mentor, Andrew, has a great 5 minute scalping strategy for Forex using these exponential moving averages.

Income Mentor Box Exponential Moving Average

Moving Averages – The Basics

Before we get into the Forex exponential moving average scalping strategy which Andrew discusses in the featured video, it’s probably a good idea to know what these are. So, what is a simple moving average, what’s an exponential moving average, what do they tell us, and how are they calculated?


Moving Averages

So, first off, we have moving averages as a whole. Moving averages is a very popular and widely used indicator. The main point of a moving average is to filter out noise from random short term price fluctuations in order to smooth out price action.

These moving averages are most often used to determine support and resistance levels and to identify trend directions. As you will see today, they are great for Forex scalping. There are a few types of these indicators, and today we want to discuss the SMA and EMA, or simple and exponential moving averages.

Exponential Moving Average
courtesy of https://www.dailyfx.com/forex/education/trading_tips/daily_trading_lesson/2019/08/13/moving-average.html

Simple Moving Average

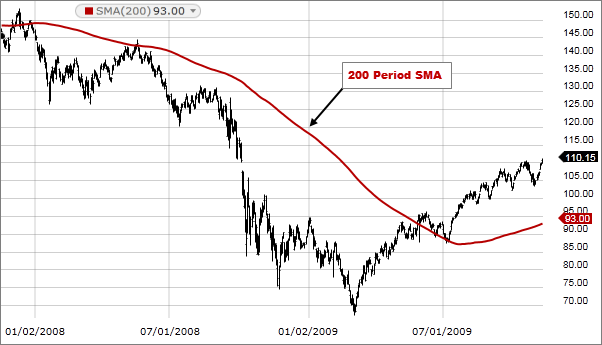
Before we get into what exponential moving averages are, you first need to know what simple moving averages are, as the latter are needed in order to calculate the former. A simple moving average is often used in Forex, and it’s calculated by adding up the closing price of an asset, in this case foreign exchange pairs, and then dividing it by the number of days added up.

Simple Moving Average
Courtesy of https://www.fidelity.com/learning-center/trading-investing/technical-analysis/technical-indicator-guide/ema

In other words, if you are working with a 20 day time frame, add up the closing price of the 20 days, then divide by 20. Simple moving averages, or SMAs are used to identify price trends and to estimate the potential for change in a trend.


Exponential Moving Average

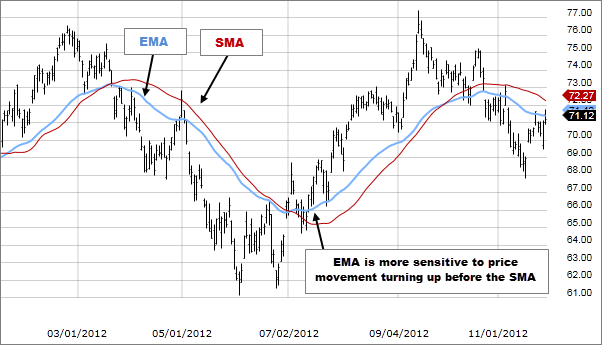
The exponential moving average is also known as a WMA or weighted moving average. This is similar to the SMA, but it places much more weight on the most recent data. The EMA responds much quicker to the most recent price changes than the SMA does, an is therefore ideal for placing short term trades.

As you will see in the featured video, Andy uses 3 EMA lines in order to trade Forex via a scalping strategy. Just so you know, scalping involved placing a large number of short term trades based on recent trends and price movements, which here are figured out through the use of the exponential moving average. EMA is best to use for short term trades in this regard.

Exponential Moving Average
courtesy of https://stockcharts.com/articles/mailbag/2013/01/what-is-the-difference-between-a-simple-and-exponential-moving-average.html

Calculating an Exponential Moving Average

Before we go over the featured video, where Andrew explains his 3x EMA strategy for Forex scalping, it’s probably wise for you to learn how to calculate an exponential moving average. Remember, the first part here is to calculate the simple moving average, which we taught you how to do in the above section. After this is done, you need to calculate the multiplier for smoothing for the previous EMA.

The formula for doing this is quite simple, [2 ÷ (selected time period + 1)]. So for a 20 day chart, the formula would be [2/(20 +1)]. Lastly, the actual EMA is then calculated using the following formula, [Closing price-EMA (previous day)] x multiplier + EMA (previous day). Yeah, it’s a little complicated, but the best way to learn and master this is simply by practicing it.

ACCESS FREE CRYPTOCURRENCY MENTOR BOX SIGNALS BELOW! 

Crypto Mentor Box Telegram Access

Andy’s Exponential Moving Average Scalping Strategy

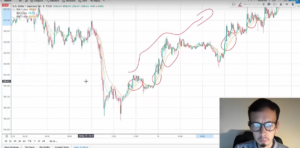
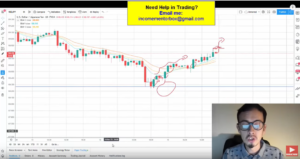
Ok, so now you know the most important basics about moving averages, specifically about exponential moving averages. Now it’s time to discuss how Andrew uses these EMA lines in order to place scalping trades in Forex. We are not going to go over a step by step tutorial in detail here, because it’s honestly a bit hard to understand with words alone. Luckily, in the featured video, Andrew goes over the whole process of this 3x EMA scalping strategy, so you can see it in action right in front of your face.

Here, Andrew uses a series of 3 separate exponential moving average lines, along with a few other things, in order to place highly profitable Forex scalping trades. Sure, these might be short term trades, and only with small investments, but the point here is sheer quantity. Yes, each trade is going to provide small profits, but those add up real fast.

Here is the basic strategy or method which Andy uses in order to place Forex scalping trades using the EMA technical indicator. Keep in mind that you should watch the embedded video, as all of the following steps are explained in great detail, and you get to watch it all unfold right in front of your eyes. It’s always easier to learn this kind of thing when you can see someone else doing it.

Exponential Moving Average

  1. Place 3 exponential moving average lines (details explained in the video).
  2. Adjust the settings according to Andy’s instructions.
  3. Wait for the proper conditions, as outlined in the trading video.
  4. Wait for the first candle to touch the EMA, and count 5 candlesticks back.
  5. Exit the trade at the next support for sell and at the next resistance if you placed a buy order.

Exponential Moving Average


Forex Scalping with Exponential Moving Averages – Conclusion

At the end of the day, this particular 5 minute Forex scalping strategy, with the exponential moving average as its basis, is one of the best for placing short term trades. Now, if you really want to learn everything there is to know in this regard, there’s no better way to do it than by joining the Income Mentor Box Day Trading Academy.

CLICK BELOW TO JOIN INCOME MENTOR BOX AND START MAKING REAL PROFITS! 

Income Mentor Box

Moving Averages & Bollinger Bands Strategy

Moving Averages & Bollinger Bands Strategy

OFFICIAL WEBSITE: IncomeMentorBox.com

Today, Andrew is here to teach you one of his very favorite trading strategies which involves moving averages and Bollinger bands. As you probably know by now, we here at the Income Mentor Box Day Trading Academy are all about teaching you to become the best day traders around.

This is why we are here today, to teach you a super simple trading strategy that should result in great ITM rates and profit levels too. As you will see in the video which we have included here, Andrew takes you on a step by step tutorial on how to put this moving averages and Bollinger bands strategy to use. Included is everything you need to know in order to be successful with this moving averages and Bollinger bands. We also have live trades to show you, trades which used this exact same trading strategy, and you better believe that the overall profits were great!

Now, the beauty of his moving averages and Bollinger bands strategy is that it is very easy to use and really should not take you long to master. Let’s take a closer look at Andrew’s moving averages and Bollinger bands strategy right now!


Moving Averages & Bollinger Bands Strategy – When To Use It

One thing that you probably want to know about this moving averages and Bollinger bands strategy is what kind of trading it can be applied to. Well, this trading strategy can be used for Forex, indices, and stocks, which is convenient no doubt. What is also nice here is that this moving averages and Bollinger bands trading strategy can be used in combination with any broker platform out there. As you can see, this particular day trading strategy is indeed quite versatile, and this is always nice because it can be applied to many types of trading.


Moving Averages and Bollinger Bands – What Do I Need?

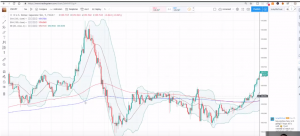
There are two things that you will need here in order to use this moving averages and Bollinger bands strategy. As the name of the strategy itself implies, the first thing that you will need to put this day trading strategy to use is the moving average. To be exact, here you will need two EMAs, or exponential moving average lines. These can be found on the charts of any broker. The other thing you will need to put this strategy to use are Bollinger Bands, which all brokers also have.


Using Moving Averages and Bollinger Bands For Day Trading

Ok, so now that you know what you need to put this day trading strategy into use, let’s go over a step by step instructional on how to put it into effect. It’s really not that hard, especially if you take a look at our Income Mentor Box Day Trading Academy moving averages and Bollinger bands video we posted here in this article.

  1. So, first things first, you need to select the currency pairing which you wish to trade with. For the purposes of this instructional, Andy chose to go with the USD/JPY pairing.
  1. Next, you need to open up the chart and add your exponential moving average line. Go to the indicators tab and fine the EMA.
  1. For the first EMA line, make it blue, and set the length to 365, because there are 365 days of the year. Now click OK. Now, set up the second line, and make it red so it stands out, and set it to 180, and click OK.
  1. Now you need to add the Bollinger bands to the chart. Go to the indicators tab and search for the Bollinger bands. It’s one of the most popular momentum indicators, so it should be available on all brokers.
  1. So, now the rule is this, if THE RED LINE IS ABOVE THE BLUE LINE, THE PRICE IS EXPERIENCING AN INCREASE. However, IF THE BLUE LINE IS ABOVE THE RED LINE, THE PRICE IS EXPERIENCING DOWNARD MOMENTUM.
  1. The next rule here is that you are looking for the candlesticks to cross the top or bottom of the Bollinger bands. If the price is touching the top of the Bollinger bands and the price is experiencing downward momentum, it indicates that you need to place a SELL trade. This also applies in the reverse order in terms of placing a BUY trade.

Moving Averages and Bollinger Bands


Andrew’s Moving Averages and Bollinger Bands Trades – SUCCESS!

Now that we here at the Income Mentor Box Day Trading Academy have taught you the basics behind this moving averages and Bollinger bands trading strategy, let’s take a look at the actual trades placed. Yes, whenever Andrew does a tutorial like this, he will use that same strategy to place trades. As you can see from the embedded video, the moving averages and Bollinger bands strategy turned out to be very profitable for Andrew.

Andrew and the Income Mentor Box Day Trading Academy placed a total of 9 trades using this moving averages and Bollinger bands strategy. Well, 7 of the 9 trades turned out to be winners. Therefore, the ITM or win rate for this trading session is approximately 78%. This is a very good win rate and it’s nothing to look down your nose at. In terms of profits, these 9 trades generated close to 2,000 Euros for Andy. Folks, making 2K in a few hours of trading is absolutely spectacular, and it proves that this moving averages and Bollinger bands strategy is indeed the real deal.

Moving Averages and Bollinger Bands profits

Moving Averages and Bollinger Bands Strategy – Conclusion

As you can see, if done right, this moving averages and Bollinger bands day trading strategy can be very successful, just like it was for Andy. If you want to become a professional day trader, we would recommend joining our Income Mentor Box Day Trading Academy. For the low price of $299, which is a onetime payment, and no hidden fees, you will get complete access to all course materials.

You will get access to over 51 trading tutorials, with more being released every day. You will also get a free day trading EBook, access to a private chat, and access to the Facebook group where free trading signals are posted every day. You can simply copy and paste these signals into your trading platform, and make a lot of money doing so, just like Andrew himself!

IMB Day Trading Academy Stock Market Tips